| Annals
of Burns and Fire Disasters - vol. X - n. 2 - June 1997
CEREBRAL OEDEMA AFTER EXTENSIVE THERMAL INJURY:
PROGNOSTIC SIGNIFICANCE OF EARLY INTRACRANIAL AND CEREBRAL PERFUSION PRESSURES
Gueugniaud P.Y., Jauff ray M., Bertin-Maghit M.,
Bouchard C., Durand F., Fonrouge J.M., Petit P.
Burn Centre, Edouard Herriot Hospital, University
of Lyons 1, Lyons, France
SUMMARY. Massive
fluid resuscitation is required after severe burn injury. This leads to extensive oedema
which can affect not only the burned skin but also unburned areas and vital organs such as
the heart and lungs. Cerebral oedema has never been systematically investigated in burn
patients, and burn encephalopathy remains a well-known but unexplained complication. A
prospective study was conducted on early intracranial and cerebral perfusion pressures in
severely burned patients with a percentage of total burn surface area (T13SA) over 60% and
a unit burn score (UBS) of up to 220. Intracranial pressure monitoring was set up as soon
as possible with an epidural screw and recorded over a period of five days. Thirty-two
patients were successively included (age = 37 ± 14 years; TBSA = 68 ± 19%; UBS 258 ±
73). Markedly abnormal cerebral pressure data were observed, mainly between days 1 and 3
post-burn: intracranial pressure peak values increased to 31.4 ± 10.4 mm Hg on day 2
post-burn. Cerebral perfusion pressures dropped to critical values also on day 2 post-burn
(41.0 ± 10.2 min Hg). Eighteen patients were discharged alive (56%). A comparison between
survivors and non-survivors showed that non-survivors always presented higher intracranial
perfusion pressures and lower cerebral perfusion pressures than survivors. The
significance between survivors and non~survivors over the five days of monitoring was
calculated by a variance analysis for repeated measures. The intracranial pressure average
was slightly above significant levels (p = 0.06). Cerebral perfusion pressure differences
were statistically significant as regards both minimum recorded values (p = 0.009) and
average values (p = 0.02), whereas mean arterial pressures were not significantly
different (p = 0. 12). These data suggest that very severely burned patients suffer
cerebral oedema capable of inducing abnormal intracranial pressure. During this initial
massive fluid resuscitation, intracranial hypertension and haemodynamic instability may
lead to deleterious cerebral hypoperfusion. It is concluded that the use of therapy for
cerebral oedema combined with catecholamines may be useful in the limitation of cerebral
perfusion after extensive burn injury.
Introduction
In 1832 Dupuytren first described
%ntensive cerebral congestion in the autopsy of patients dying after burn injury. Since
then, many cases of neurological sequelae of burns have been reported, especially in
children The concept of burn encephalopathy was thus created and defined as the
acute onset of change in sensorium or the occurrence of seizures and abnormal neurological
signs, or both, at any time after the initial burn injury.` In 1981, Mohnot et al.
reported that burn encephalopathy resulted from "complex metabolic, hematological and
hemodynamic abnormalities father than from a single metabolic abnormality. If cerebral
oedema was once thought to be an inevitable component of burn encephalopathy, it has
rarely been described subsequently, except in burned and asphyxiated children." On
the other hand, extensive oedema in severely burned patients can affect not only the
burned skin but also unburned areas` and certain vital organs, such as the myocardium` and
kings.
We therefore decided, after observing some unexplained neurological complications
following burn therapy, to include intracranial pressure (ICP) and cerebral perfusion
pressure (CPP) monitoring in our routine intensive care management of major burns.
Patients and methods
Patients
In accordance with the care protocol applied in our Centre since 1991, and with the
approval of our local ethics committee, we monitored early ICP and CPP in all adult
patients suffering extensive thermal injury with a percentage of total burn surface area
(TBSA) over 60% (including face burns), with a unit burn score (UBS) index (calculated as
% TBSA + 3 x % full-thickness burn area) of over 220, and when the delay between the burn
injury and the ICP set-up was less than 24 hours.
Patients with prior vital organ dysfunction or associated injuries (polytrauma,
intoxication, lung injury, electrocution, etc.) were not analysed, as the aim of the study
was to outline the consequences of isolated burn injury. Serious coagulation problems on
admission constituted another criterion for exclusion.
Methods
On admission, a double lumen central intravenous line was introduced percutaneously into
the superior vena cava and an indwelling arterial femoral catheter was inserted. All
patients were intubated and ventilated in order to obtain adequate deep sedation by means
of flunitrazepan and phenoperidine (initially 0.4 mglh and 0.8 mg/h, respectively). Fluid
resuscitation was achieved according to Evans'formula with 3-4 ml/kg/% T13SA on day 1 and
2 ml/kg/% on days 2 and 3, with half crystalloids (Ringer) and half colloids (alburnin
4%). In the event of pressure collapse or inadequate urine output in spite of this
standard fluid filling, i.e. mean arterial pressure (MAP) < 70 mm Hg and diuresis <
0.5 ml/k,-,/h), the haemodynamic profile was analysed by inserting a blood flow-directed
balloontipped pulmonary artery catheter and optimized by introducing catecholamines:
dobutamine, when the cardiac index (Cl) was < 3 1/min/m', and doparnine, when the
systemic vascular resistances indexed (SVRI) were < 600 dyn.sec/cm5.ml. The
catecholamine infusion rate was increased if necessary: if a 20 y/kg/min dopamine infusion
proved ineffective to maintain sufficient SVRI, we switched to norepinephrine. In other
respects, biological values were maintained: haemoglobin 10 g/dl; Pa02 12 kPa;
PaC02 :5 6 kPa; pH 7.3; natraemia 130 mmol/1; proteinaemia 50 g/1.
An epidural screw (Hirsch-Sainte Rose type, 1CP kit, Plastimed, France) was set up as soon
as possible and when workable in a nonburn area. Extensive disinfection was effected in
the trephine hole with 10% povidone-iodine (BetadineR; Asta Medica, M6rignac, France)
achieved before the screw was inserted and after it was removed some days later. Samples
were also taken daily during a monitoring system flush for bacterial cultures. 1CP and
invasive blood pressure were both monitored continuously. CPP values were calculated
directly by the monitoring calculator (Space Labs 9030 A, USA) (CPP = MAP - 1CP). This
complete management was performed for at least the first five days of evolution.
Therapy protocol
We considered the cerebral pressure range to be norm al when ICP was !~ 20 turn Hg and CPP
over 50 turn Hg. An ICP level over 20 turn Hg was recorded as such if after a monitoring
system flush and a controlled zero this level was confirmed at least three times over a
period of 15 min without any stimulation of the patient.
Abnormal ICP values were treated first by an IV bolus of 3 mg/kg weight thiopentone,
repeated when necessary, followed by continuous thiopentone infusion if the IV bolus was
not sufficient to maintain normal ICP. A low CPP level was treated either by an initial
continuous 'dopamine infusion starting at 5 y/kg/min, increasing 5 7/kg/min every 10 min
if necessary, or by increasing the previous catecholarnine infusion rate. In the event of
simultaneous high ICP, an IV bolus of thiopentone was injected during the increasing amine
infusion rate when MAP reached at least 70 turn Hg.
Data analysis
1CP and CPP average values representing the average of all hourly values recorded each day
are reported. Extreme 1CP, MAP and CPP values, which are the highest 1CP value and the
lowest MAP and CPP values recorded each day, are also reported. Data are expressed as mean
± SD. Survivor (S) and nonsurvivor (NS) groups are compared. A paired Student's t test is
used for daily comparison of the average continuous variables between the two groups: a p
value < 0.05 was considered statistically significant. Analysis of variance for
repeated measures is used to compare the monitoring of the two groups over the five days.
Results
Thirty-two successive patients (age, 37 ±
14 years; TBSA burns, 68 ± 19%; UBS, 258 ± 73) admitted to our centre between January
1990 and January 1994 were studied. The first ICP measurements were achieved within a mean
of 13.3 ± 8 hours. Fifty-six per cent of the patients (18/32) were discharged alive
without neurological sequelae. None of the patients died during the first three days;
three patients died between days 4 and 5 because of multiple organ failure. Death occurred
after day 10 in eleven patients owing to septic complications (eight patients) and/or
cardiopulmonary complications (three patients) unrelated to direct cerebral after-effects.
No complications arose as a result of the epidural technique, e.g. haemorrhage or
infection: no organism grew in any of the samples during this period. These data must not
conceal the potential dangers of infection, especially if the trephine hole is drilled in
a burned skin area: however, we probably prevented septic complications because of the
strict technique employed (respecting dural integrity) and the wide use of local
disinfectant. Table I shows no significant difference between S and NS groups by
age, TBSA or time before first 1CP recording. Fluid requirements during the first two days
were marginally higher in the S group than in the NS group (3.8 vs 3.2 ml/kg/% TBSA on day
1; 2.5 vs 2.2 ml/kg/% T13SA on day 2). Abnormal cerebral pressures values were clearly
found throughout the first three days post-injury in all patients (Table II).
| |
Age
(years) |
TBSA
(%) |
UBS |
Delay
between injury
and first ICP
measurement (hours) |
Overall population
(n = 32) |
37 ± 14 |
68 + 19 |
28 + 73 |
13.3 ± 8 |
Survivors
(n = 18) |
31 + 11 |
66 ± 19 |
256 ± 70 |
15,3 ± 9,5 |
Non-survivors
(n = 14) |
45 + 14 |
69 ± 20 |
260 ± 80 |
10,4+3,9 |
| TBSA: total burn
surface area; UBS: unit burn score; lCP: intracranial pressure |
|
Table I -
Characteristics of the patients studies and comparison between survivors and non-survivors
(expressed as mean + SD) |
|
| |
Day
I
(n = 29) |
Day
2
(n = 32) |
Day
3
(n = 32) |
Day
4
(n = 30) |
Day
5
(n = 29) |
JCP peak values
(mm Hg) |
25.5 ± 9.0 |
31.4 ±
10.4 |
29.8 ± 9.7 |
22.8 ± 9.3 |
21.7 ± 9.0 |
Minimum CPP
(mm Hg) |
42.1 ±
15.4 |
41.0 ±
10.2 |
43.9 ± 9.4
|
48.8 ±
12.2 |
54.8 ±
12.2 |
1CP average
(mm Hg) |
16.3 ± 6.2 |
18.1 + 6.5 |
16.2 ± 7.2
|
15.0 ± 7.5
|
13.8 ± 6.8 |
CCP average
(mm Hg) |
58.0 ±
13.2 |
59.0 + 8.4 |
63.7 ±
10.0 |
63.6 + 11.7
|
67.5 ±
14.3 |
| lCP:
intracranial pressure; CPP: cerebral perfusion pressure; MAP: mean arterial pressure |
|
Table II
- Maximum lCP, minimum CPP, minimum MAP, and average of daily values for ICP and CPP
during 5 days'management (expressed as mean ± SD) |
|
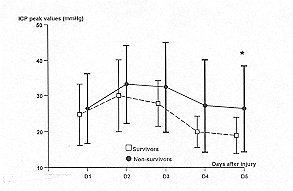
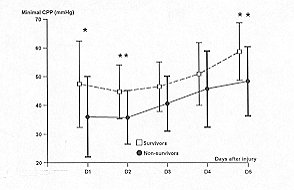
The highest pathological
values were observed on day 2: 1CP maximum values, 31.4 ± 10.4, 1CP average, 18.1 ± 6.5
mm Hg; minimum CPP, 41.0 ± 10.2, CPP average, 59.0 ± 8.4 mm Hg.
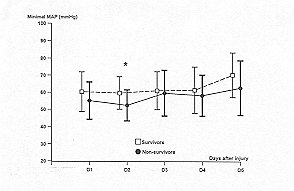
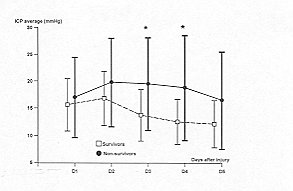
A comparison of these values in S and NS groups is presented in Table III. During
the first week postinjury, ICP values were always higher and MAP and CPP values lower in
the NS group than in the S group. The difference is statistically significant for minimum
CPP (p = 0.009) and CPP average (p = 0.02) (Figs. 2 and 5). The significance is
borderline for ICP average (p = 0.06) (Fig.4). ICP peaks and minimum MAP values were
not significantly different (respectively 0,11 and 0.12) in either group (Figs. I and 3).
If we consider the daily comparison for each variable, we can identify a significant
difference on each day: on day 1, minimum CPP (Fig. 2); on day 2, minimum CPP and minimum
MAP (Figs. 2 and 3); on days 3 and 4, ICP average (Fig. 4); on day 5, maximum ICP (Fig.
1), minimum CPP (Fig. 2), and CPP average (Fig. 5).
| Variables |
Days
post-injury |
Day I |
Day 2 |
Day 3 |
Day 4 |
Day 5 |
1CP peak values
(mm Hg) |
S |
24.7 ± 8.5 |
30.0 ± 10.1 |
27.8 ± 6A |
19.9 ± 4.3 |
18.9 ± 5.1 |
NS |
26.4 ± 9.7 |
33.2 ± 11.0 |
32.4 ± 12.2 |
27.2 + 12.9 |
26.4 + 12. 1 * |
Minimum CPP
(mm Hg) |
S |
47.4 ± 15.0 |
44.7 ± 9.3 |
46.5 ± 8.6 |
50.9 +10.9 |
58.7 + 10.8 |
NS |
36.0 ± 14.0* |
35.8 ± 9.3# |
40.6 ± 9.5 |
45.7 + 13.2 |
48.4 + 12. 1 # |
Minimum MAP
(mm Hg) |
S |
60.3 ± 11.6 |
59.6 ± 9.5 |
61.0 ± 11.1 |
61.3 + 13.5 |
70.1 + 13.5 |
NS |
55. t ± 10.9 |
52.4 ± 9.1* |
59.6 ± 13.4 |
58.1 ± 12.0 |
62.6 + 16.0 |
ICP average
(narn Hg) |
S |
15.6 ± 4.8 |
16.8 ± 5.0 |
13.7 ± 4.7 |
12.5+4.1 |
12.1 ± 4.3 |
NS |
17.0 ± 7.4 |
19.8 ± 8.2 |
19.5 + 8.6* |
18.8 ± 9.7* |
16.5 ± 9.0 |
CPP average
(mm Hg) |
S |
62.6 ± 13.3 |
61.1 ± 8.8 |
65.2 ± 8.8 |
65.9 + 10.4 |
71.7 ± 13.9 |
NS |
53.4 ± 11.9 |
56.2 ± 7.2 |
61.8 ± 11.5 |
60.2 ± 13.1 |
61.2 + 13.0* |
1CP: intracranial
pressure; CPP: cerebral perfusion pressure; MAP: mean arterial pressure;
* = p _ 0.05; # = p < 0.02 in comparison with S group day by day (Student's t test) |
|
Table III -
Patterns of cerebral pressure variables (mean ± SD) of survivors (S) and non-survivors
(NS) during 5 days'management |
|
 |
 |
| Fig. 1 -
Temporal patterns of maximal inuacianial pressures (ICP) in sin v ivors (S = dashed line)
and non-survivors (NS = solid line). Vertical Imrs represent SR A paired Student's t test
is used to compare the daily average variables between the two groups: * = p < 0.05.
Differences over all days of monitoring are calculated by analysis of variance for
ic[)eated measures: p = 0.11. |
Fig. 2 -
Temporal patterns of minimal cerebral perfusion pressures (CPP) in survivors (S = dashed
line) and non-survivors (NS = solid line). Vertical bars represent SD. A paired Student's
t test is used to compare I lie daily average variables between the two groups: * = p <
0.05; ** = p - 0.02. Differences over all days of monitoring are calculated by analysis of
variance for repeated measures: p = 0.009. |
|
 |
 |
| Fig. 3 -
Temporal patterns of minimal mean arterial pressures (MAP) in survivors (S = dashed line)
and non-survivors (NS = solid line). Vertical bars represent SEl. A paired Student's t
test is used to compare the daily average variables between the two groups: * = p <
0.05. Differences over all days of monitoring are calculated by analysis of variance for
repeated measures: p = 0. 12. |
Fig. 4 -
Temporal patterns of daily intracranial pressure (ICP) average in survivors (S = dashed
line) and non-survivoys (NS = solid line). Vertical bars represent SD. A paired Student's
t test is used to compare the daily average variables between the two groups: * = p <
0.05. Differences oveT all days of monitoring are calculated by analysis of variance for
repeated measures: p = 0.06. |
|
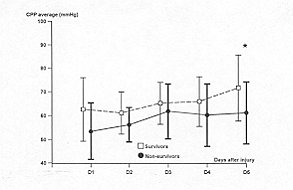 |
Fig. 5 -
Temporal patterns of daily perfusion pressure (CPP) average in survivors (S = dashed line)
and non-survivors (NS = solid line). Vertical bars represent S1). A paired Student's t
test is used to compare the daily average variables between the two groups: * = p <
0.05. Differences over all days of monitoring are calculated by analysis of variance for
repeated measures: p = 0.02. |
|
During this period, all patients received
at least one catecholamine to improve the haemodynamic profile. Dopamine was specifically
indicated for cerebral hypoperfusion and allowed to increase CPP in seven patients (three
in the S group and four in the NS group). Twentyfive out of the 32 patients needed at
least one thiopentone IV bolus, and continuous thiopentone infusion was necessary to treat
ICP levels over 20 mm Hg in 16 patients (six in the S group, ten in the NS group). In
spite of this planned therapy protocol, intracranial pressure was incompletely controlled
in patient in the NS group.
Discussion
The first study of neurological
complications in burns dates from 1832, when Duptlytren described %ntensive cerebral
congestion" in the autopsies of burned children. ifle causes of these neurological
disturbances were initial ly attributed to cerebral oedema," demyelination' or
"lc)xins",21 and more recently to complex metabolic, hae matological and
haemodynamic abnormalities.` The incidence of burn-related encephalopathy has varied from
1 to 85%. Nowadays, numerous aetiologies are discussed: hypoxia, hypovolaemia, acidosis,
hyponatraemia, hyperglycaemia, infection, etc.
During the last year in our centre, we have observed several central system dysfunctions
after severe burn injury and prolonged intensive care: various neuropsychiatric
manifestations, convulsions, and three cases of severe neurological deficit with
quadriplegia in which a diagnosis was made of central pontine myelinolysis.` This
burn-related complication has long been known? It may be linked to cerebral oedema. 4,22
Moreover, in the first days postinjury and during the necessary initial fluid overload,
oedema in severely burned patients is extensive, affecting unburned areas and some vital
organs.
In the light of this evidence, we suspected the occurrence of brain hypertension due to
cerebral oedema, which could be involved in burn encephalopathy.' In our study, 1CP and
CPP abnormalities were observed in the first three days post-injury, particularly on day 2
(respectively 31.4 ± 10.4 and 41 ± 10.2 nim Hg). During this period, 1CP peaks and CPP
reductions may be deleterious for the brain. The drops in MAP linked to the usual initial
haemodynamic disturbances in critically burned patients lead to a precarious and even
life-threatening cerebral perfusion. The average daily values are obviously less
meaningful because of the therapies systematically administered in order to correct the
abnormal values. When we compare the data according to outcome, abnormal 1CP and CPP
values are still recorded in both groups. The study nevertheless shows that survivors' 1CP
and CPP values were always nearer the norm than those of non~suirvivors. The fact that all
patients received catecholamine infusion and that 78% of them required thiopentone to
normalize 1CP could be due to mean pressures being in the upper normal range and sometimes
similar in both groups. We realize that the lack of a control group in our study makes
these values questionable. An analysis of variance for repeated measures calculated
throughout all the days of monitoring shows that CPP differences between the S and NS
groups were statistically significant for both minimum recorded values and average values.
The 1CP average difference was of borderline significance, while 1CP peak differences and
minimum MAP differences were not significant. In other respects, when we compare variables
day by day, we find altemalively significant differences for all values, but we note that
three variables appear significantly different on the same day, i.e. day 5. At this point
in the evolution, which represents the end of the acute post-injury phase, survivors seem
to be able to normalize intracranial homeostasis better than nonsurvivors: these results
suggest that variations in 1CP and especially CPP could at least reflect survival chances.
Nevertheless, if the two groups are not statistically different, one must be cautious
because a difference of 14 years between the two groups may well increase the difference
in mortality curves. Burn patient prognosis can be improved by increasing fluid filling,
according to Miller et al.or by increasing Cl and oxygen delivery and oxygen consumption,
according to others.In this study, cerebral oedema was not directly related to fluid
overload. The explanation of cerebral oedema occurring at some distance from the burned
areas is still unknown: the role of cytokines, which are involved in burn mortality, needs
to be discussed,` particularly that of interleukin-6, which may considerably increase
between days 2 and 4 post- injury. In conclusion, the ability to maintain cerebral
pressures may itself represent a favourable prognostic factor in severely burned patients,
even if we cannot affirm that 1CP monitoring and the control of cerebral pressures by
specific therapy improve survival.
RESUME. Dans les suites
d'une brûlure grave, l'indispensable remplissage vasculaire majore le développement d'un
oedème tissulaire étendu dépassant les zones brûlées pour atteindre les tissus sains
et également certains organes vitaux, comme le coeur et les poumons. L'oedème cérébral
n'a jamais jusqu'à présent été recherché de façon systématique chez les brûlés
graves, alors que l'encéphalopathie du brûlé est une entité bien connue dont le
mécanisme reste incertain. Nous avons mesuré prospectivement de façon précoce la
pression intracrâmenne et la pression de perfusion cérébrale chez les brûlés les plus
graves admis dans notre centre avec une surface cutanée brûlée (SCB) dépassant 60% et
un score UBS (unit burn score) dépassant 220. La mesure de la pression intracrânienne a
été débutée le plus tôt possible grâce à un capteur extradural: l'enregistrement a
été réalisé en continu pendant cinq jours. Trente-deux patients ont été
successivement inclus dans l'étude (âge = 37 ± 14 ans; SCB = 68 ± 19%; UBS 258 ± 73).
Les valeurs des pressions cérébrales sont très pathologiques, principalement entre le
premier et le troisième jour après la brûlure: les pressions intracrâniennes maximales
atteignent 31,4 ± 10,4 mm Hg au deuxième jour. De même, la pression de perfusion
cérébrale atteint également sa valeur la plus critique le deuxième jour (41 ± 10,2 mm
Hg). Dix-huit patients guérissent (56%). La comparaison réalisée entre les pressions
cérébrales des survivants et des non-survivants montre que les patients qui vont
décéder présentent toujours des pressions intracrâmennes plus élevées et des
pressions de perfusion cérébrale plus basses que ceux qui vont survivre. La
significativité entre les survivants et les décédés au cours des cinq jours de
l'enregistrement de la pression intracrânienne a été calculée par analyse de variance
pour mesures répétées. Les pressions intracrâniennes moyennes sont à la limite de la
significativité entre les deux groupes (p = 0,06). Par contre, les différences entre les
pressions de perfusion cérébrale des deux groupes sont statistiquement significatives à
la fois pour les valeurs minimales de pressions (p = 0,009) et pour les valeurs moyennes
(p = 0,02), alors qu'au contraire les pressions artérielles moyennes ne sont pas
différentes (p = 0,12). Ces résultats suggèrent que les brûlés les plus sévères
présentent un oedème cérébral qui peut entraîner d'éventuelles anomalies des
pressions cérébrales. A cette phaseinitiale de la réanimation du brûlé grave,
l'hypertension intracrâmenne associée à la fréquente stabilité hémodynantique peut
conduire à des épiso des d'hypoperfusion cérébrale responsable d'éventuelles
complications encéphalopathiques. Cette constatation peut justifier l'association d'ami
oedémateux cérébraux et de catécholamines pour permettre de contrôler au mieux les
perfusions cérébrales chez les brûlés les plus graves.
BIBLIOGRAPHY
- Cobb S., Lindemann E.: Burns -
neuropsychiatric observations. Ann. Surg., 117: 814-24, 1943.
- Hugues L.: Burns with cerebral
complications. Med. J. Aust., 2: 122, 1947.
- Lindsay W.K., Murphy E.G., Birdsell
D.C.: Thermal burn encepha lopathy. Can. J. Surg., 8: 165-71, 1965.
- Emery J.L., Reid D.A.C.: Cerebral oedema
and spastic herniplegia following minor burns in young children. Br. J. Surg.,
50:53-6,1962.
- Haynes B.W., Bright R.: Burn coma: a
syndrome associated with severe burn wound infection. J. Trauma, 7: 464-75, 1967.
- Hall K.V.: Encephalopathy complicating
burn injuries in children. Scand. J. Plast. Reconstr. Surg., 2: 59-63, 1968.
- Warlow C.P., Hinton P.: Early
neurological disturbances following relatively minor burns in children. Lancet, 2: 978-82,
1969.
- Rosenbloom C., Kravath R.: Neurological
disturbances following minor burns. Lancet, 2: 1423, 1969.
- Mettler F.A.: Burn encephalopathy as a
diagnosis. J. Med. Soc. N. J., 71: 817-23, 1974.
- Antoon A.Y., Volpe J.J., Crawford J.D.:
Burn encephalopathy in children. Pediatrics, 50: 609-16, 1972.
- Prekop R.: Brain edema in burned
children. Acta Chir. Plast., 26: 184-92, 1984.
- Roth N.: Encephalopathy due to burns.
Arch. Neurol. Psych., 45: 980-3, 1941.
- Bender L.: Burn encephalopathy in
children. Arch. Pediatr., 60: 70 87, 1943.
- Mohnot D., Snead O.C., Benton J.W.: Burn
encephalopathy in children. Ann. Neurol., 12: 42-7, 1982.
- Kay S., Siva Rao G.S., Lord D. et al.:
Intracranial pressure monitoring as an aid to resuscitation in the burnt and asphyxiated
child: three case reports. Burns, 12: 212-3, 1986.
- Demling R.H.: Fluid resuscitation after
major burns. JAMA, 250: 1438-40, 1983.
- Cioffi W.G., Demeules J.E., Gamelli
R.L.: The effects of burn injury and fluid resuscitation on cardiac function in vitro. J.
Trauma, 25: 638-42, 1986.
- Shoemaker W.C., Vladeck B.C., Bassin R.
et al.: Burn pathophysiology in man: 1. Sequential hemodynamic alterations. J. Surg. Res.,
14: 64-73. 1973.
- Kruse F.: Enzephalitis und Amauruse nach
Verbrennung. Dtsch. Med. Wochenschr., 54: 1029-41, 1928.
- Madow L., Alpers B.J.: Brain changes in
patients with extensive body burns. Arch. Neurol. Psychiatry, 72: 440-51, 1954.
- Kaye E.M., Butler E.J.: Neurologic
complications of burns in childhood. In: "Burns in children", Carjaval HF.,
Parks D.H. (Eds.), Chicago, Medical Year Book, 280-6, 1988.
- Bertin-Maghit M., Gueugniaud P.Y.,
Bouchard C. et al.: Perturbations neurologiques après réanimation des brûlés graves:
à propos d'un cas évoquant une myélinolyse centre-pontine. Réanim. Urg., 5: 49-52,
1996.
- Globus J.H., Bender M.B.: Disseminated
toxic degenerative encephalopathy (disseminated sclerosing demyelination) secondary to
extensive and severe burns. J. Nerv. Ment. Dis., 85: 518-29, 1936.
- Gueugniaud P.Y., Bertin-Maghit M.,
Pannefier J.C. et al.: Hypertension intracrAmenne et hypoperfusion cerebrate: une
complication habituelle des br6l6s graves. Press. Med., 21: 1482, 1992.
- Miller J.G., Bunting P, Burd D.A.R.,
Edwards J.D.: Early cardiorespiratory patterns in patients with major burns and pulmonary
insufficiency. Burns, 20: 542-6, 1994.
- Bernard F., Gueugmaud P.Y., Bouchard C.
et al.: Etude des paramètres h6modynamiques chez le brW grave pendant les 72 premieres
heures. Ann. Fr. Anesth. R6anim., It: 623-8, 1992.
- Bernard E, Gueugniaud P.Y.,
Bertin-Maghit M. et al.: Prognostic significance of early cardiac index in severely burnt
patients. Burns, 20: 529-31, 1994.
- Drost A.C., Burleson D.G., Cioffi W.G.
et al.: Plasma cytokines following thermal injury and their relationship with patient
mortality, burn size and time postburn. J. Trauma, 36: 335-9, 1993.
- De Bandt J.P., Chollet-Martin S., Hemvan
A., et al.: Cytokine response to burn injury: relationship with protein metabolism. J.
Trauma, 36: 624-8, 1994.
- Gueugmaud P.Y., Vilasco B., Pham E.,
Hirschauer C., Fabreguette A., Bertin-Maghit M., Petit P.: Brûlés graves: état
hémodynamique, transport et consommation d'oxygène, cytokines plasmatiques. Ann. Fr.
Anesth. R6anirn., 15: 27-31, 1996.
| This paper was
received on 21 November 1996. Address correspondence to: Dr Docteur Pierre-Yves Gueugniaud
Centre de Réanimation et de Traitement des Brûlés
Hôpital Edouard Herriot, Place d'Arsonval, 69437 Lyons, France Cedex 03. |
|