| Annals of Burns and Fire Disasters -
vol. X - n. 3 - September 1997
ALGORITHM FOR ANALYSIS OF PLASMA
GLUCOSE IN THE POST-BURN SHOCK STAGE
Roa L. 1
Havel E.,2 Blàha V.2
1,2
Purkinje Military Medical Academy, Charles University Teaching Hospital,
2 Department of Surgery, Burns Unit, Department of Gerontology and
Metabolism
Hradec Kralove, Czech Republic
SUMMARY. Burn injury
increases plasma glucose concentration and decreases plasma volume. In this situation,
glycaernia is not an accurate reference of the dynamic behaviour of extracellular glucose.
We presentan algorithm for the analysis of extracellular glucose behaviour in 36 burn
patients duririg the shuck stage: 35 casas resuscitated with a high rate and volume of a
colloid-free crystalloid solution and 21 resuscitated with a medium rate and volume
of a colloid and crystalloid solution. With our algorithm the dynamic behaviour of
extracellular glucose after burn injury - a period with abrupt changes in extracellular
volume- can be analysed.
Introduction
The development of hyperglycaemia soon after burning has been
related to body burn surface area (BSA) and the depth of the wound. Hyperglycaemia is not
an isolated phemonenon. It appears in a scenario of changes of amino acids, free fatty
acids, triglycerides, insulin, human growth hormone, cortisol, glucagori, and adrenalin
concentrations, Hypermetabolism, hyperpyrexia, immunodepression,' increased production of
endogenous glucose, amino acid and fatty acid mobilization, and water retention are all
characteristics of the immediate response to a major burn injury, A physiological reset
occurs in response to stress that alters the hormonal milieu. The hypennetabolic response
to thermal injury is maximum in burns as small as 20% total 13SA and increases with
additional burn size from heat loss.' These temporal changes are adaptive to noxious
stimuli, but eventually result in progressive catabolism and deterioration. Hypovolaemia-related
cardiovascular dysfunction can occur during this time owing to increased vascular
permeability.
In the absence of sepsis, most cases of post-burn hyperglycaemia require no specific
therapy. Clinical and experimental studies on glucose kinetics after a burn injury are
related to its plasma concentration. The quotient between total plasma glucose and plasma
volume, in a situation with abrupt changes in the extracellular volume distribution, is
not an adequate indicator of carbohydrate metabolism.
Different fluid resuscitation guidelines have been designed for the treatment of burn
patients. Most of these solutions include carbohydrates. The effect of intravenous
infusion of these substances in a hyperglycaemic situation is not well documented.
The complexity of the problem has originated this algorithm approach, which allows us to
analyse extracellullar glucose behaviour during the first hours after a major burn.
Material and methods
1. Computational methods and theory
We base our algorithms on the physical law of mass conservation. In order to determine
plasma and interstitial volumes in the burn patient, our algorithms use data such as age,
sex, weight, height, body BSA, fluid inputs, diuresis, haematocrit, and plasma protein
concentration.We presume that plasma glucose concentration is equal to extracellular
concentration. This assumption is consistent with most metabolic studies. Fig. I presents
a flow diagram including these variables and the relations considered in this study. On
the basis of this hypothesis, we infer the differential equations that control the plasma
and interstitial glucose turnover:
and
We can thus deduce:
|
= |
|
+ |
|
= GI - ECGU - GD1 - GLEX |
(3) |
Both equations can be expressed as:
and
| GDPI - GDIC - GLEX |
= |
|
= |
|
(5) |
As glucose concentration data are discreet, we transform
the differential equations to equations in differences. Thus, using the Euler method, we
obtain:
TPG (k) = TPG(k-l) + DTX [ GI(k-l) - PGCO(k-l) - GDI
(k-l) ] (6)
TGIN (k) = TGIN(k-l) + DTX [GDPI (k-l) - GDIC(k-l) - GLEX (k-l) ] (7)
Glucose concentration, exogenous input glucose, and glucose loss by
exudation values are calculated by means of linear interpolation of clinical data. From
equation (2) we know the net balances between glucose supplies and elimination in the
plasma and interstitial compartments.
Thus:
PGNB(k-l) = GI(k-l) - PGCO(k-l) |
= |
| TGP(k) - TGP(k-l) + GDI(k-l) |
| DTX |
|
(8) |
|
|
|
|
| IGNB(k-l) = GDPI(k-l) - GDIC(k-l) |
= |
| TGP(k) - TGP(k-l) + GLEX(k-l) |
| DTX |
|
(9) |
adding (3) and (4) we obtain:
ECGNB(k-l) = GI(k-l) - ECGU(k-l) + INGNB(k-l) (10)
2. Clinical application of the algorithm
As an example of the validity and utility of the algorithm the clinical data of 36
non-diabetic burn patients were retrospectively analysed. Patients were divided in two
groups according to the resuscitation guidelines applied. Patients in Group 1 were
resuscitated with the Parkland guideline (lactated Ringer 4 tnl/kg/% BSA during the first
24 h, half of this volume infused during the first 8 h and the other half in the following
16 h).
Patients in Group II were resuscitated according to the BET guideline (human seroalburnin
in factated Ringer, with a decreasing concentration from 10 to 7.5, 5, 2.5 and 0%,
depending on the post-burn time, (0-8 h, 8-16 h, 16-24 h, 24-40 h and
over 40 h, respectively), with an infusion rate of 220 ml/m2/BSA/h.
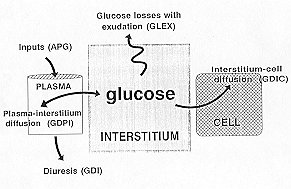 |
Fig. I - Simplified diagram of
the variables and their relations considered in the analysis of extfacellular glucose
exchanges after burn injury. |
|
Results
Thirty-six patients were included in the study: 15 in Group I and 21 in Group II.
The characteristics of these patients. The mean values of BSA, age, sex, height,
weight, and body mass index of both groups were comparable.
|
GROUP 1
| |
Age
(yr) |
Sex |
Weight |
Height |
BSA |
BMI |
| ACR |
56 |
m |
65 |
165 |
15 |
23.8 |
| MRS |
39 |
F |
50 |
155 |
20 |
20.8 |
| JCV |
50 |
m |
0 |
165 |
10 |
31.2 |
| MMM |
40 |
m |
70 |
168 |
23 |
24.8 |
| RFN |
40 |
F |
910 |
165 |
is |
33 |
| MSG |
27 |
m |
70 |
170 |
40 |
24.2 |
| RRG |
23, |
m |
55 |
167 |
45 |
19.7 |
| AGC |
28 |
m |
65 |
165 |
45 |
2. |
| AGR |
62 |
m |
90 |
170 |
.50 |
31.1 |
| MDG |
15 |
m |
65 |
175 |
50 |
21.2 |
| FTC |
31 |
m |
90 |
175 |
50 |
29.4 |
| JFM |
49 |
m |
55 |
160 |
70 |
21.5 |
| TVS |
18 |
F |
55 |
160 |
75 |
21,5 |
| RRA |
34 |
m |
94 |
174 |
80 |
27.7 |
| JAFA |
30 |
m |
80 |
175 |
90 |
26.1 |
| s.d. |
13.6 |
|
13.7 |
5,9 |
219 |
4.1 |
| Average |
36.7 |
|
11,2 |
167.2 |
46.5 |
25,3 |
GROUP II
| JCHI |
13 |
F |
55 |
150 |
24 |
24.4 |
| LVC |
58 |
m |
75 |
165 |
25 |
27.5 |
| CBG |
25 |
m |
63 |
173 |
30 |
21 |
| JHI |
44 |
m |
85 |
175 |
30 |
27.7 |
| AMM |
22 |
m |
83 |
178 |
30 |
26.2 |
| MAEM |
30 |
F |
70 |
160 |
30 |
27.3 |
| BSC |
23 |
F |
57 |
165 |
33 |
21 |
| VLG |
37 |
F |
55 |
160 |
35 |
21.5 |
| MLS |
69 |
m |
55 |
155 |
40 |
22.9 |
| AMPI |
30 |
m |
70 |
180 |
40 |
21.6 |
| ABL |
55 |
m |
70 |
170 |
42 |
24.2 |
| AMP |
66 |
m |
65 |
160 |
45 |
25.4 |
| JRC |
48 |
m |
78 |
170 |
50 |
27 |
| MPML |
54 |
m |
62 |
170 |
50 |
21.4 |
| BNC |
21 |
m |
70 |
170 |
55 |
24.2 |
| JRA |
63 |
m |
60 |
165 |
55 |
29 |
| CLL |
28 |
F |
60 |
160 |
62 |
22 |
| JMA |
34 |
m |
65 |
160 |
65 |
25.4 |
| SM |
45 |
m |
71 |
170 |
80 |
24.6 |
| JMSR |
21 |
m |
75 |
180 |
90 |
23.1 |
| ARR |
30 |
m |
70 |
165 |
90 |
25.7 |
| s.d. |
16.3 |
8.6 |
7.8 |
19.8 |
2.2 |
|
| Average |
38.9 |
67.3 |
166.7 |
47.5 |
24.1 |
|
BMI: body mass index (BMI = weight (kg) / [height (m)] ) |
Table 1 - Patient
resuscitation |
|
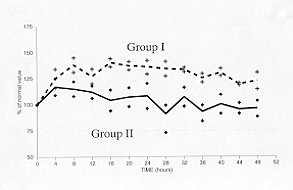 |
Fig. 2 - Haemoconcentration is a
consequence of burn injury. Its level is related to BSA. The mean value of venous
haematocrit was higher in the group of patients treated according to the Parkland
guideline (Group 1) than in the group treated according to the BET guideline (Group II). |
|
Haernoconcentration was related to both BSA and resuscitation therapy
and was higher in Group I than in Group 11. Plasma protein concentration decreased in all
cases, in relation to BSA and the type of fluid used during the resuscitation
period.'-" Plasma volume was higher in Group 11 (Fig. 3a). The interstitial
volume, obtained by the algorithm, increased in Group I more than in Group 11 (Fig.
3b).
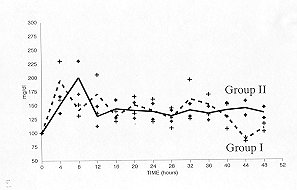
Plasma glucose concentration increased above its normal value immediately after injury
and remained at that level throughout the period considered. There were no significant
differences between the two groups of patients (Fig. 4).
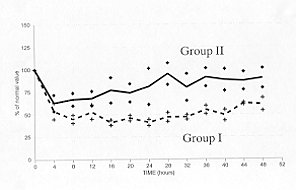
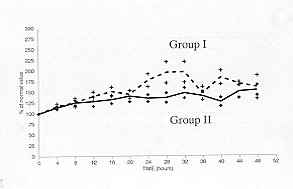
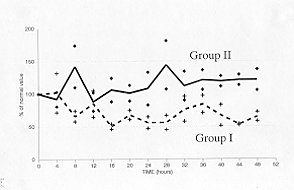
The total glucose in plasma and the interstitial compartments can be calculated from
the relative volumes and concentrations. Patients resuscitated with the BET guideline
(Group 11) showed higher values of total plasma glucose (Fig. 5) and lower values
of total interstitial glucose (Fig. 6).
 |
 |
| Fig. 5 - The values of the variable
total of plasma glucose was higher in patients resuscitated with colloids
(Group 11). |
Fig. 6 - The values of the total
interstitial glucose were higher than normal in both groups, but less so in
Group II. |
|
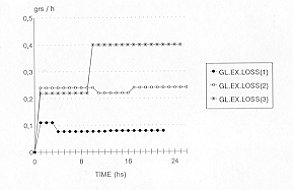
Fluid loss through burn wounds is related to BSA." Its composition
is comparable with interstitial volume. Glucose concentration in the exudation fluid is
assumed to be equal to that of plasma. The glucose loss values in the exudate can be
estimated on the basis of these assumptions (Fig. 7). These losses are substantial
in patients with major BSA.
|
Fig. 7 - Glucose losses in the
exudate can be calculated by our algorithm. These losses are related to glucose
concentration and fluid exudation, and are substantial in patients who have sustained
severe burns. This variable, in three patients who suffered burns in 30, 60 and 80% BSA,
is represented as GL.EX.LOSS (1), (2) and (3), respectively. |
|
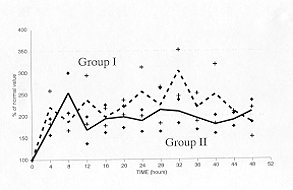
Relations between plasma and interstitial glucose flows, exogenous
glucose inputs and endogenous glucose production can be defined as plasma glucose net
balance (PGNB). This variable oscillated close to normal values (zero g) in the patients (Fig.
8). Oscillations from a positive to a negative glucose balance were related to the
time interval post-injury and resuscitation therapy. These behaviours were not justified
by the exogenous infusion of carbohydrates during the resuscitation period.
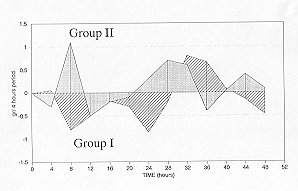 |
Fig. 8 - The plasma net glucose
balance, which shows the glucose flows between plasma and the interstitial compartments
and exogenous and endogenous glucose inputs, oscillates close to normal values, zero
grams, in the period analysed. |
|
Discussion
In the immediate post-burn period phase, there is a decrease in
nutrient flow and oxygen delivery to cells. The pyrocatechol discharge and the glucagon,
insulin and corticosteroid release are part of the response to injury. Carbohydrate
metabolism is altered in burn Patients during the shock phase in relation to the severity
of the injury." Although glucose production increases and peripheral uptake is
normal, the entrance of glucose into the Krebs cycle is reduced. In these stress states,
the administration of excess glucose can have detrimental metabolic effects.
A transition occurs from the immediate post-burn phase to the flow phase. The latter is
characterized by catabolism, hypermetabolism, and a negative nitrogen balance. Although
the initial glucose intolerance begins to resolve, hyperglycaemia may still be evident.`
This transient period has not been analysed in detail, probably because it has been
considered irrelevant.
Our algorithm demonstrates that a change exists in the glucose stock in the patient's
interstitial compartment, depending on the type of resuscitation guideline used. Similar
behaviour was observed in the interstitial volume, which was higher in Group I than in
Group II patients. The stock of extracellular glucose was related to the post-burn
increase in the interstitial volume and to the resuscitation therapy selected.
The interstitial compartment acts as a mattress for the carbohydrates, in a clinical
situation where changes in plasma and interstitial volume are frequent and considerable.
Most of these carbohydrates are endogenous. The exogenous administration of lactate, at
least in our patients, is not relevant, if we consider the glucose eliminated with the
exudate. However, hyperglycaemia and glucosuria have been described with glucose infusions
during this period.
In order to observe an increment in extracellular glucose in the burn patient, it is
necessary to have a lower glucose turnover. Glucose utilization in these patients must be
decreased, as it is related to burn severity. These findings are confirmed by clinical and
experimental data published by different authors and validate our algorithm. Some
behaviours obtained still require analysis. The control mechanisms that regulate net
glucose exchanges between plasma, interstitium and intracellular compartments are not yet
included in the algorithm.
Conclusion
In our opinion, the algorithm that we present is a simplc follow-up
method for metabolic carbohydrate disorders in the post-burn shock stage. Its most
striking aspect is its simplicity for obtaining relevant behaviours of non-accessible
variables that are very indicative of the state of the system and very difficult to obtain
in daily clinical practice.
RESUME. La brûlure augmente la concentration du glucose
plasmatique et diminue le volume du glucose. Dans cette situation, la glycémie n'est pas
un indicateur exact du comportement dynamique du glucose extracellulaire. Les Auteurs
présentent un algorithme pour l'analyse du comportement du glucose extracellulaire chez
36 patients brûlés pendant la phase du choc: la réanimation a été effectuée en 15
cas avec un taux et un volume élevé d'une solution crystalloïde libre de colloides et
en 21 cas avec un taux et un volume moyen d,une solution colloïde et crystalloïde.
L'algorithme présenté permet d'analyser le comportement dynamique du glucose
extracellulaire après la brûlure, dans une période caractérisée par des changements
rapides des volumes extracellulaires.
BIBLIOGRAPHY
- Davies JW.: The metabolic responses. In: "Physiological responses to burning
injury", Academic Press, London, 1982.
- Muller M., Herndon D.: Hormonal interactions in burned patients. Seminars in Nephrology,
1314: 391, 1993.
- Roa L., G6mez-Cfa T., Cantero A.: Analysis of the extracellular protein and fluid shifts
in burn patients. Burns, 12: 337, 1986.
- Baxter C., Shires T.: Physiological response to crystalloid resuscitation. Ann. N. Y.
Acad. Sci., 150: 874, 1968.
- Nygren J., Samman M., Malm M,: Distributed anabolic hormonal atterns in burned patients:
the relation to glucagon. Clin. Endocrinol. Oxf., 43: 491, 1995.
- Allgower M., Schoenenberger G., Sparkes B.: Burning the largest immune organ. Burns, 21:
Suppl. I S7, 1995,
- Kelemen J., Cioffi W., Mason A., Mozingo D., McManus W., Pruitt B.: Effect of ambient
temperature on metabolic rate after thermal injury. Ann. Surg., 223: 406, 1996
- Nguyen T., Gilpin D., Meyer N., Herndon D.: Current treatment of severely burned
patients. Ann. Surg., 223: 14, 1996
Roa L., G6mez-Cfa T.: A burn patient resuscitation designed by computer simulation (BET).
Part 1: simulation studies. Burns, 19: 324, 1993.
- G6mez-Cfa T., Roa L.: A burn patient resuscitation designed by computer simulation
(BET). Part 2: initial clinical validation. Burns, 19:332,1993.
- Davies J.W., Lanake L.O., Li1jedahl S.O.: A guide to the rate of non-renal water loss
from patients with burns. Br. J. Plast. Surg., 27: 325, 1974.
- Wilmore D., Orcutt T., Mason A.: Alterations in hypothalamic function following thermal
injury. J. Trauma, 15: 697, 1975.
- Wolfe R.: Metabolic responses to burn injury: nutritional implications. Seminars in
Nephrology, 13: 382, 1993.
- Demling R.: Management of the burn patient. In: "Textbook of Critical Care",
2nd ed., W. Shoemaker, S. Ayres, A. Grenvick, P. Holbrook, W. Thompson (eds), W.B.
Saunders Co., Philadelphia, 1989
- Carter E., Tompkins R., Babich J., Correia L, Fischman A.: Decreased cerebral glucose
utilization in rats during the ebb phase of thermal injury. J. Trauma, 40: 930, 1996.
- Wolfe R., Allshop J., Burke J.: Glucose metabolism in man: responses to intravenous
glucose infusion. Metabolism, 28: 210, 1979.
Montegut W., Lowry S.: Nutrition in burn patients. Seminars in
Nephrology, 13: 400, 1993.
This paper was received on 24 April 1997.
Address correspondence to: Prof, Laura Roa
Ingenieria de Sistemas y Automatica
Escuela Superior de Ingenieros Industriales,
Avda. Reina Mercedes s/n
41012 Seville, Spain. |
|