Annals of the MBC - vol. 2 - n' 3 - September 1989
CALORIMETRIC
EVALUATION OF ENERGY EXPENDITURE IN BURNED PATIENTS
Casadei k Enzi W, Chiarelli k Zurio F*, Martini G.,
Campagna C.
Istituto di Chirurgia Plastica, Universita di Padova,
Italia
* Dipartimento di Medicina interna, Universita di Padova, Italia
SUMMARY. The human organism
responds to diflerent types of stress (traumas, burns, infections) with an increase of
energy expenditure and caloric requirement. In burned patients the resting metabolic rate
(RMR) increases in relation to the burned surface area showing a weight loss due to
increased catabolism, protein loss from burned surfaces and immobilization. Therefore, it
is very important to evaluate energy expenditure of burned patients to ensure good
nutritional administration both quantitatively and qualitatively. For this purpose, 6
burned patients (2 males and 4 females) (burned surface area 20-40% and average age 35.4
years +/- 5.2) were studied for 40 days at the Padua Burn Centre. During this period, the
following nutrients were administered IN.: glucose 10%, amino acids (Freamine 111) and
lipids (Intralipid 10%); others were given by naso-gastric tube: ready to use semi-liquid
nutrients (Nutrisond Nutricia; 1 Keal/mL) and whenever needed: polysaline solutions,
plasma, blood and albumin units. Energy expenditure was measured with open circuit
indirect calorimetry (MMC Horizon Beckman Sensor Medies). Two types of measurements were
carried out: 1) Basal Metabolic Rate (BMR), or energy expenditure of a patient at rest (on
a patient, in the morning, fasted at least 12 hours at a constant temperature); and 2)
Resting Metabolic Rate (RMR), or energy expenditure of a subject at rest who is
continuously fed for at least 8 hours through a naso-gastric tube. During calorimetric
tests, heart rate (HR) and axillary body temperature ('C) were monitored. The patients'
BMR was 2090 +/- 148.5 Kcal. The BMR pattern was two-phase, with higher values at the end
of the second week following the injury and a progressive decrease during the subsequent
weeks.
Significant correlations were observed
between BMR, burned surface area (P<0.005) and body weight (P<0.001). A significant
variation of BMR values was seen between the Ist and 5th week of study (P<0.01) while
there were no significant variations in RMR. Post-prandial thermogenesis (diet-induced
thermogenesis = DIT) expressed in % BMR was 12.3 +/- 5.5 during the Ist week, 8.9 +/- 3.8
in the 2nd week and 8.6 +/- 2.4 during the entire observation period. During the Ist week
metabolism had an average increase of 150% compared to what is expected in the normal
population based on age and body surface area. The respiratory quotient (RQ = C02/02) of
BMR during the 40 days
of study was 0.82 +/- 0.01 (mean value)
and a significant difference (P< 0.0 1) was observed from the resting RQ during
nutrition (RQ = 0.76 +/- 0.01). RQs during the first (P<0.001) and the second week
(P<0.005), but not during the subsequent ones. Average values of body temperature were
37.9 'C during the first week and 38.0 'C during the second with subsequent decrease to
normal values in the weeks that followed. Temperature correlation with energy
expenditure/square metre (P < 0.00 1) and HR (P < 0.00 1) was significant. HR during
BMR had an average values of 103 +/- 2 bts/min with a significant correlation with energy
expenditure (P< 0.001). These results give us a quantitative evaluation of increased
metabolism, nutritional requirement, variation of post-prandial thermogenesis and RQs with
very reliable measuring methods in ditTerent phases of burns.
Introduction
Indirect calorimetry originated in
Paris when Lavoisier informed J. Black in Edinburgh in 1780 of the results of his studies
on oxygen consumption in different metabolic conditions.
The theoretical bases of calorimetry were created between 1890 and 1930, and Rubner, a
student of Voit, constructed a special box for the study of direct and indirect
calorimetry in dogs. In 1900 he defined the energy value of different kinds of food.
Today acute and chronic pathologies are diagnosed and treated with ever more sophisticated
methods, but the caloric needs of the patients, determined by these methods, are not
always reconfirmed by experimental data (1).
Indirect calorimetry is more and more frequently used to get information about the
nutrition of patients in many different clinical situations. It has been demonstrated that
the use of a mouthpiece or a mask is not suitable for clinical measurements; as
hyperventilation alters respiration, there is an increase of carbon dioxide and
consequently of the respiratory quotient (RQ). But in 1964 Kinney created a new method of
measurement, using a continuously ventilated canopy, which makes it possible to obtain
correct data by measurements which last long enough in patients in condition of complete
rest. This method was perfected by computer and transformed into a portable instrument.
Indirect calorimetry evaluates the heat production by measuring the consumption of oxygen
and the production of carbon dioxide, which are always produced during an oxidative
process or combustion.
By measuring the oxygen consumption we can calculate the quantity of chemical energy
transformed into heat. Every kind of food produces during oxidation a certain quantity of
heat for every litre of oxygen consumed, representing its caloric equivalent. The
respiratory quotient RQ (relation between C02 produced and 02 used) varies with the kind
of substance oxidated.
The RQ of carbohydrates corresponds to 1, of lipids to 0.7, and of proteins to 0.8. For a
cocktail of carbohydrates and lipids there is a linear relation between RQ variation and
the caloric equivalent of oxygen; both change due to percentage variations of lipids or
carbohydrates in the cocktail. In humans, measuring the urinary excretion of nitrogen
allows us to evaluate precisely the entity of proteic oxidation of the organism. There is
a variation of the caloric equivalent, shown by the lowering of the right-hand line (which
explains the relation between RQ and caloric equivalent), but without any modification of
the inclination. One should notice that the variation of the caloric equivalent due to
proteins is very slight (Fig. 1).
In indirect calorimetry the correct measurement of oxygen used is very important, and if
all measurements are exact the possibility of global error is lower than 1%.
The purpose of our work was to evaluate as precisely as possible, by the use of indirect
calorimetry, the nutrition of a group of burned patients, trying to adapt alimentation to
the patients' real needs by measuring the energy expenditure and caloric contribution.
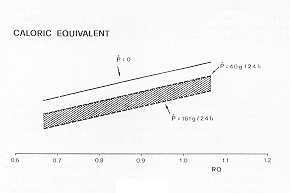 |
Fig. 1 |
|
Materials and methods
We studied six burned patients (4
females, 2 males) aged between 18 and 49 years (average 35.4 +/5.2) with total burned
surface area between 20% and 40% (mean 29.1 +/- 3.6), mean total area 0.50 sqm, full
thickness burns between 5% and 17% (mean 12.4 +/- 5.6) of body surface area, for an
average period of 40 days (Tab. 1). During this period the patients were treated in the
following way: initial fluid resuscitation according to Parkland's formula, topical wound
care with Silvadene during the first week and active physical and occupational therapy. In
4 patients tangential wound excision was performed between the 3rd and 5th day after
injury.
Patient
n' |
Age
(yr) |
Burned
surface
area (%) |
Burned
surface area(sqm) |
Full-thickness
burned area
(%) |
weight
(Kg) |
height
(cm) |
| 1 |
34 |
30 |
0.45 |
10 |
50.0 |
160 |
| 2 |
24 |
25 |
0.39 |
9 |
55.8 |
156 |
| 3 |
49 |
35 |
0.58 |
14 |
62.0 |
160 |
| 4 |
45 |
40 |
0.79 |
17 |
87.0 |
168 |
| 5 |
38 |
25 |
0.44 |
7 |
70.0 |
163 |
| 6 |
18 |
20 |
0.35 |
5 |
64.6 |
171 |
| |
| Mean |
35.4 |
29.1 |
0.50 |
12.4 |
64.9 |
163.0 |
| SEM |
5.2 |
3.6 |
0.16 |
5.6 |
5.2 |
2.3 |
|
| Tab. 1 PATIENTS'
CLINICAL DETAILS |
|
In the beginning we medicated the patients every day, and
later on when needed.
Alimentation consisted of semiliquid ready-to-use food of constant composition (Nutrisond
Nutricia; I Kcal/mL) given by n.g. tube. In the post-operative period the patients were
treated with parenteral therapy with solutions of glucose 20%, aminoacids (Freamine 111)
and lipids (Intralipid 10%). After the first two days of fasting, the diet of all patients
was about 1000 Kcal/day, increased subsequently by 500 Kcal every day until the calculated
daily needs were reached.
| |
BMR |
| Patient
N' |
predicted
(Keal/24h) |
measured
(Kcal/24h) |
% of
prediction |
| 1 |
1260 |
2097 |
166 |
| 2 |
1300 |
1689 |
130 |
| 3 |
1340 |
1635 |
122 |
| 4 |
1710 |
2250 |
131 |
| 5 |
1480 |
2321 |
157 |
| 6 |
1720 |
2553 |
148 |
|
| Tab. II - BASAL
METABOLIC RATE |
|
Energy expenditure was measured by indirect open circuit
calorimetry, using a portable calorimeter (MMC Horizon Beckman Sensor Medics). This
calorimeter is able to analyse inspired and expired gas by a polygraphic sensor for oxygen
and an infrared sensor for carbon dioxide. Indirect open circuit calorimetry by ventilated
canopy is the best method for long-term measurements (from 20 minutes to many hours) (3).
The patient's head is in a see-through canopy connected with the air source by a flexible
tissue tube. An aspirator fixed on the extraction tube assures continuous air change in
the canopy. The air flow is regulated at six times the expiration volume of the patient,
avoiding in this way excessive C02 concentration in the canopy and also maintaining a
slightly negative pressure to prevent air loss. On exit from the canopy, part of the
expired air is analysed for the determination Of its 02 and C02 level (knowing the air
flow, one can calculate the total volume Of 02 consumed and C02 produced) (Fig. 2).
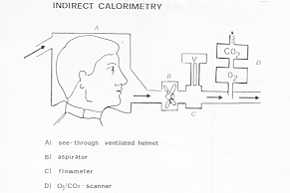 |
Fig. 2 |
|
At the end of the test we collected the
urine for the determination of urine urea nitrogen (UUN) (4).
In our work we performed two types of measurements: 1) the basal metabolic rate (BMR), or
energy expenditure of a patient at rest, in the morning and without food for at least 12
hours and in conditions of thermic neutrality; and 2) the resting metabolic rate (RMR), or
energy expenditure of a patient at rest and with continuous alimentation for at least 8
hours. We also performed 8 measurements not at rest in order to evaluate the metabolic
effect of medication.
During the calorimetric tests we monitored heart rate (HR) and body temperature ('C).
There was daily registration of the quantity of calories given constantly to the patient
and after the fourth post-injury day calories were calculated according to the 13MR (BN1R
x 1.3). Every day we determined the quantity of UUN in the 24-hours-urine collection and
during calorimetric measurements by spectrophotometric method (5). The patients were
weighed at least twice a week.
Our results were statistically processed by one-way Anova analysis.
Results
During the first and second week of
study the patients' metabolisms had an average increase of 150% compared to that expected
in the normal population, based on age and body surface area (6), decreasing slowly to
120% during the fourth week (Tab. II). The measured caloric requirements were lower than
those calculated by Curreri'(2) (Tab. III).
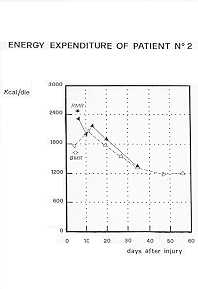
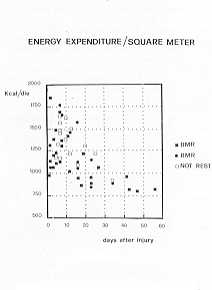
In Fig. 3 we illustrate the pattern of BMR and RNIR of one burned patient; there is an
evident two-phase pattern with higher values at the end of the second week and a
progressive metabolic decrease during the following weeks. The same pattern can be noted
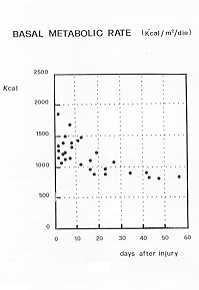
evaluating the BNIR of all burned patients, with the basal metabolism expressed in square
meters (Fig. 5). There is a significant correlation between BNIR, burned surface area (2nd
week p<0.005) and weight (P < 0.00 1).
In our observations the measured BMR was 1169 +/- 45 Kcal/day/sqm. There is also an
important variation (p < 0.0 1) in the BNIR values of the first and the fourth week of
study.
 |
 |
| Fig. 3 |
Fig. 4 |
|
 |
 |
| Fig. 5 |
Fig. 6 |
|
The 4th week predicted BMR was 9% lower t.han the 1 st
week BMR and in the 4th week of study the measured BMR (BMR x 1.3) was 15% higher than the
predicted BN1R.
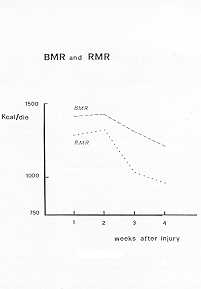
The average BMR values of the first four weeks of study is comparable to the average RMR
values of the same period (Fig. 6). The variance analysis shows no significant RMR
modifications during these weeks; there is however a positive correlation between RMR and
time (p< 0.05).
In stress situation measurements, or "not at rest-, during medication, the average
energy expenditure was 1280 +/- 118 Kcal/day/sqm, a 9.49% increase compared to the BMR.
Fig. 6 shows all measurements of energy expenditure for body surface area/sqm. The average
calories, calculated on BMR, in constant administration to the patients, were 2531
Kcal/day. The weekly results are shown in Tab. IV.
There is an important difference (p<0.02) comparing statistically the mean BMR and RMR
values of the 40 days of study. There is no difference comparing the single week values.
Diet-induced thermogenesis (DIT) expressed as a percentage of BMR in the first week was
12.3 5.5, in the second week 8.9 +/- 3.8, and overall 8.6 2.4; expressed in diet calories
the percentage was in the first week 11.9 +/- 3.9, in the second week 5.2 +/- 3. 1, and
overall 6.6 +/- 1.7.
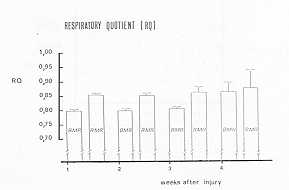
The mean respiratory quotient (RQ), measured in basal situations (BMR), was 0.82 +/- 0.01,
and dillered significantly (p<0.01) from RQ at rest during alimentation (average values
0.86 +/- 0.01). RQs during 13MR and RMR were significantly different during the first
(p<0.001) and the second week (p< 0.005), but not during the following weeks (Fig.
7). The RQ in BMR, correlated to time, had a significant variation (p< 0.0 1), while
the RQ in RMR had none. The weekly average is shown in Tab. V.
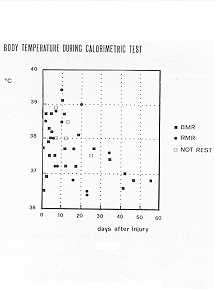
The weekly average body temperature values are shown in Tab. VI. The average axillary
temperature during the first week was 37.9 'C, and in the second week 38.0 'C. The values
normalized within 30 days. Temperature correlation with energy expenditure/sq m (p <
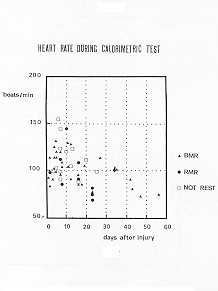
0.00 1) and HR (p < 0.00 1) was significant (Fig. 8). The weekly average values of HR
are shown in Tab. VII. During calorimetric tests at rest HR was 103 +/- 2 beats/min and
had a significant correlation with time (p<0.001) and with energy expenditure
(p<0.001) (Fig. 9). UUN increased in the first and second week without any significance
compared to normal values. The total weight loss in the 30 days after injury was 5.9 +/-
2.2%.
Discussion
The purpose of our work was to
evaluate a protocol for the exact assessment of the nutritional state of burned patients.
Until today the caloric requirement was determined by Curreri's formula, based on the
patient's weight and the percentage of burned surface. The formula is suitable for the
indirect calculation of the caloric requirement. The first part of our work regards the
study of the usefulness of the formula for energy expenditure, referring to indirect
calometric values. This method
of energy expenditure and also evaluates variations of
BMR, RQ and RMR in burned patients, both in acute phase and recovery. Our data show that
the basal metabolism increases in the first and second week, and then decreases. In the
first and second week the increase was 150% compared to the predicted BMR, based on body
surface and age; in the fourth week it decreased to 120%. Therefore, four weeks after
injury, * RMR in the recovery phase, there is still hypermetabolism (measured BMR is 15%
higher than predicted BMR).
The fourth week predicted BMR is 9% lower than the first week BMR, due to weight loss,
showing that the metabolic needs decrease with time, due to the decrease of lean body mass
causing a lower caloric requirement than pre-burn, although hypermetabolism persists.
Together with an initial BMR increase there was also a significant HR and temperature
increase. The variation of these data is significatively correlated, showing the
possibility of using HR measurements as a prediction for the actual individual energy
expenditure.
Body temperature is also correlated to basal apidly gives information about individual
energy expenditure, with very little disturbance to the patient; it is also very easy to
perform. The results of our study show, as other Authors refer (7, 8, 9), that the average
value of 24-hour energy requirements in the 6 patients, according to Curreri's formula, is
higher than that predicted (Tab. 111). Indirect calorimetry allows an exact measurement
metabolism, raising the question whether the basal metabolic increase is due to
hyperthermia. We observed also hypermetabolism in patients without fever during recovery.
We calculated that the RQ, whose values allow us to know both the oxidative processes and
utilized substrates, is significantly different during fasting from the RQ during constant
alimentation. The average fasting RQ in the burned patients studied is 0.81, corresponding
to normal subjects. Apparently this shows a normal substrate use in the short fasting
period necessary for BMR measurement.
Burned patients with negative energy balance show a lean body mass loss with proteolysis
due to gluconeogenesis. Despite the weight loss and increase of UUN excretion of the
patients, the average RQ value was 0.80, indicating gluconeogenesis activation. The
resulting RQ value may therefore depend on nutritional glucose oxidation processes, on
glycogencilysis or on gluconeogenesis in previous days.
Determination of the UUN permits the evaluation of the actual protemic oxidation process
entity, and therefore makes it possible to calculate, depending on the RQ, the proportions
between the various substrates.
In constant nutritional conditions (RNIR) the average RQ was 0.86, corresponding to the
food RQ (relation between total C02 produced and total 02 consumed).
According to the observation of other Authors (10, 11), the more revealed RQ and food
correspond, the better the utilisation of all given substrates.
The RQ never exceeded 0.95, which was revealed in the fourth week, possibly depending on
hypernutrition.
These studies on burned patients are only preliminary preparations and verifications for a
protocol of the nutritional conditions and needs of such patients. Further research is
still necessary to confirm our results.
RÉSUMÉ. L'organisme humain
répond aux divers stress (traumatismes, brûlures) avec une augmentation de la dépense
énergétique et du besoin calorique. Chez les brûlés le taux métabolique, en condition
de repos, augmente par rapport à la surface corporelle brûlée; il y a aussi une
réduction pondérale due au catabolisme augmenté, aux pertes protémiques des surfaces
brûlées et à l'immobilisation. Il est donc indispensable d'évaluer la dépense
énergétique des brûlés afin de régler l'administration nutritive soit
quantitativement soit qualitativement. A cette fin, au Centre des Brûlés de Padoue, nous
avons étudié pour 60 jours 6 patients brûlés (2 mâles, 4 femelles, surface corporelle
brûlée 20-60%, âge moyen 35,4 +/- 5,2). Pendant cette période nous avons administré
les nutriments suivants i.v.: le glucose 10%, les aminoacides (Freamine 111) et les
lipides (Intralipid 10%); et d'autres nutriments avec le tube nasogastrique: les
nutriments semiliquides prêts à l'emploi (Nutrisond Nutricia-Pierrel 1 Kcal/mL), et en
cas de besoin: les solutions polysalines, le plasma, le sang, l'albumine.
La dépense énergétique a été mesurée avec la calorimétrie indirecte à
circuit ouvert (MMC Horizon Sensor Medics). Nous avons exécuté deux types d'évaluation:
Taux Métabolique Basal (TMB), c'est-à-dire la dépense énergétique du sujet en
condition de repos (le matin, après le jeûne du sujet pendant au moins 12 heures à
température constante), et le Taux Métabolique à Repos (TMR), c'est-à-dire la dépense
énergétique du sujet à repos qui est alimenté avec le tube nasogastrique pendant au
moins 8 heures. Pendant les tests calorimétriques nous avons suivi au moniteur la
fréquence cardiaque (FQ et la température corporelle axillaire ('C).
Le TMB des patients était 2090 +/- 148,5 Kcal. Le cours du TMB était biphasique,
avec des valeurs plus élevées à la fin de la deuxième semaine après la lésion et une
diminution progressive pendant les semaines successives. Nous avons observé des
corrélations significatives entre le TMB, la surface corporelle brûlée (P< 0,005) et
le poids corporel (P< 0,001). Nous avons observé une variation significative entre les
valeurs du TMB à la première semaine d'étude et celles de la neuvième semaine (P
0,01), mais aucune variation des valeurs du TMR. La thermogenèse postprandiale (la
thermogenèse déterminée par la diète (TDD), exprimée en % du TMR, était 12,3 +/- 5,5
pendant la première semaine, 8,9 +/- 3,8 pendant la teuxième semaine, et 8,6 +/- 2,4
pendant l'entière période d'observation. Le métabolisme, pendant la première semaine,
montrait une augmentation moyenne de 150% par rapport à ce qu'on peut attendre chez une
population normale, avec référence à l'âge et la surface corporelle brûlée. Le
quotient respiratoire (QR = C02/02) du TMR pendant les premiers 60 jours était 0,82
+/-0,0 1) (valeur moyenne) et nous avons observé une différence significative (P <
0,0 1) par rapport au QR en condition de repos pendant l'alimentation (QR = 0,76 +/-
0,01). Les QRs pendant le TMB et le TMR étaient significativement différents pendant la
première semaine (P<0,001) et la deuxième (P<0,005), mais non plus pendant les
semaines successives. Les valuers moyennes de la température corporelle étaient 37,9 'C
pendant la première semaine, et 38,0 OC pendant la deuxième, avec une réduction
successive et le rétablissement des valeurs normales dans les semaines suivantes. La
corrélation de la température avec la dépense énergétique/mètre carré (P < 0,00
1) et avec la FC (P < 0,00 1) était significative. La FC pendant le TMB avait une
valeur moyenne de 103 +/- 2 battements par minute, avec une corrélation significative
avec la dépense énergétique (P< 0,001). Ces résultats nous donnent une évaluation
quantitative du métabolisme augmenté, des besoins nutritifs, de la variation de la
thermogenèse postprandiale et des QRs, grâce à la grande fiabilité des méthodes de
mesurage employées pendant les diverses fases des brûlures.
BIBLIOGRAPHY
- Kinney J.M.: "Energy Metabolism. Surgical
nutrition". Fisher J.E. ed., Little Brown & Co., Boston, Toronto, 1983.
- Curreri P.W., Richmond D., Maruen J.A., et al:
Dietary requirements of patients with major burns. J. Am. Diet, Assoc., 65: 415-17, 1974.
- Jequier E.: Long term measurement of energy
expenditure in man: direct or indirect calorimetry? In: Recent advances in obesity
research 111. Biontorp P., Cairella M., Howard AX, eds., 130, John Libley, London, 1981.
- Jequier E.: Métabolisme energetique. Nutrition.
EMC. Paris, 11, 1980.
- Kaplan A.: Urea nitrogen and urinary ammonia. In:
Meites S., ed. Standard methods of clinical chemistry, 245-56, Academic Press, New York,
1965.
- Harris J.A., Benedict F.G.: A biometric study of
basal metabolism in man. Washington D.C., Carnegie Institute of Washington. Publication n'
279, 1919.
- Schane J, Goede M, Silverstein P.: Comparison of
energy expenditure measurement techniques in severely burned patients. JBCR, 8: 366, 1987.
- Turner W.W. Jr, Ireton C.S., Hunt J.L. and Baxter
C.R.: Predicting energy expenditures in burned patients. J Trauma, 25: 11, 1985.
- Saffle J.R., Medina E., Raymond J., Westenskow D.,
Kravitz M., Warden G.D.: Use of indirect calorimetry in the nutritional management of
burned patients. J Trauma, 25: 32, 1985.
- Flatt J.P.: The biochemistry of energy expenditure.
In: Recent advances in obesity research. 11. Bray G.A., ed., 211, Newman Publishing Co.,
London, 1978.
- Zurlo F, Schutz Y., Frasearolo P., Enzi G, Deriaz
0., Jequier E: Variability of resting energy expenditure in healthy volunteers during
fasting and continuous enteral feeding. Crit. Care. Med., 14: 535, 1986.
|